Published on February 26, 2019
Written by Paul Bradley
eQAfy, Data for better higher education websites and digital governance

NOTE FROM THE #PSEWEB EDITORIAL TEAM: eQAfy’s Paul Bradley is back on the #PSEWEB blog with a two-part overview analysis of the higher education social media landscape. eQAfy, a web estate monitoring service to boost higher education website user experiences, content quality and accessibility, is one of our many exciting vendors for the 2019 #PSEWEB conference.
Previously …
Our earlier article described the Canadian university and college social media landscape, revealing that five networks dominate higher education social media, that LinkedIn has built the largest audience and launched our prototype social media effectiveness ranking.
This time we ‘crunch the numbers’ on the five networks to see what the data reveals about engagement and content creation, mindful that we’re only analysing official institutional accounts and their publicly-available data.
Every post-secondary institution in Canada has a Facebook account, but engagement, measured in number of Likes, spans a huge range. So, we segmented institutions into, Group I comprising universities and colleges with fewer than 16,000 Likes and Group II for those with more than 16,000 Likes.
The histogram in Chart 1 sets out the distribution of Likes for members of Group I. The vertical axis is the proportion of institutions in each category bucket on the horizontal axis. For example, 6% of institutions have attracted 2,000 Likes.
Charts 1 and 2’s skewed data distributions suggest that averages aren’t meaningful in setting benchmarks for engagement. We’ve used median values, instead. The median number of Likes for members of Group I is 5,775. In other words, 50% of institutions have fewer than 5,775 likes, while 50% have more than this value.
The most successful member of Group I is Mount Saint Vincent University, which had accumulated 15,974 Likes, as of mid-February 2019.
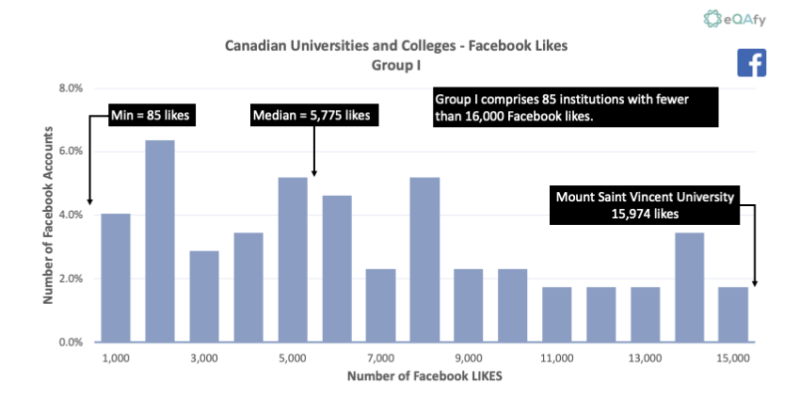
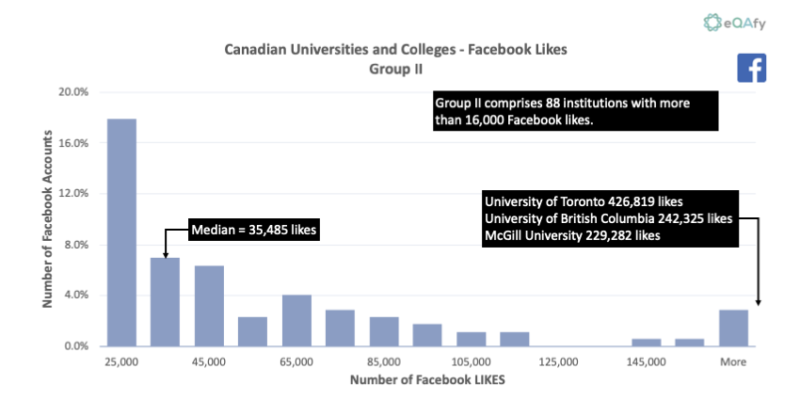
Chart 2, shows the distribution of Likes for members of Group II. Those with more than 16,000 Likes. Reflecting a similar US data pattern, a small number of institutions are outliers with eight to ten times the median number of Likes.
The histogram reveals that 80% of universities and colleges have accumulated fewer than 45,000 Likes. The small number of accounts with significantly higher numbers of Likes, don’t represent good benchmarks for higher education Facebook activity.
In Canada, the University of Toronto, UBC and McGill have ‘outsized’ Facebook engagement, all some way behind Harvard University’s 5.3 million Likes.
A reminder that we only collected data for official institutional Facebook accounts. Colleges and universities may have dozens or hundreds more Facebook accounts spread across their web estates and we venture that activity levels for these accounts are less well understood than for official accounts.
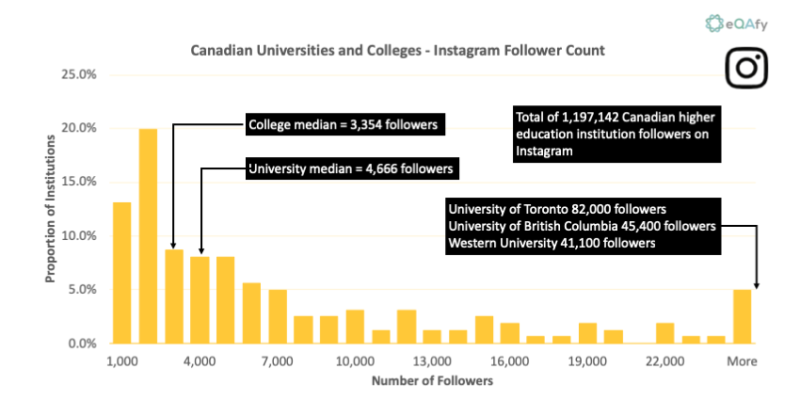
Instagram provides number of followers (an engagement measure) and post (a content creation measure) data for analysis. Instagram’s follower numbers (equivalent to Facebook Likes) can be readily captured in a single chart as they are not as widely dispersed.
Canadian university and college Instagram account follower numbers are concentrated in the 1,000 to 5,000 range, and effectively top out at 19,000 followers: only 10% of institutions have more than 20,000 Instagram followers.
In chart 3 we have plotted the median follower counts for colleges and universities, as there was a material difference, with the latter being about 40% larger than the former. Overall, Canadian post-secondary institutions have attracted close to 1.2 million followers.
As is the case with the distribution of Facebook Likes, a small outlier cluster accounts for a disproportionate level of Instagram engagement. The University of Toronto, UBC and Western, collectively have 14% of all Instagram followers.
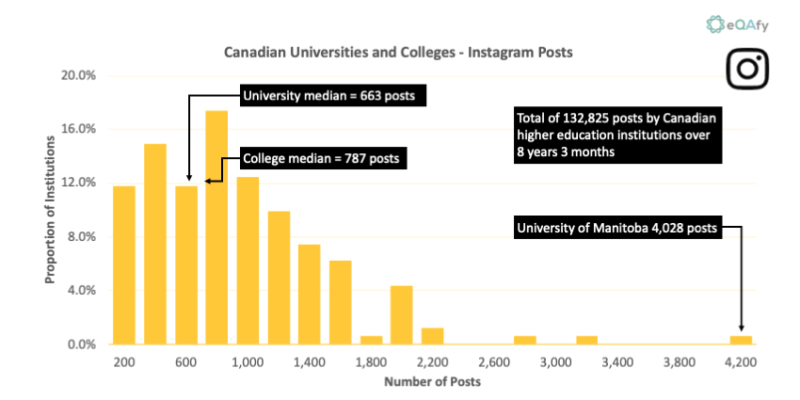
Over the eight years that Instagram has been in existence, Canadian university and college Instagram accounts have made about 130,000 posts. However, 70% of institutional Instagram accounts have fewer than 1,000 posts: with the median college account posting 20% more than its university equivalent.
The University of Manitoba’s official Instagram account has posted over 4,000 times and thus occupies top spot.
Ninety-nine per cent of Canada’s post-secondary institutions are on Twitter.
Twitter provides tweet count, follower count and account activation date data, which means content creation statistics can be ‘normalized’ to adjust for an account’s age, thus offering more meaningful comparison.
One third of Canada’s higher education institutions have fewer than 4,000 followers, 50% have fewer than 6,240 followers. As Chart 3 in our first article points out, Twitter has only 36% reach of the alumni of Canada’s post-secondary institutions. Given the potential audiences of future, past and current students, staff, faculty, media, research partners etc. the observed follower numbers seem low.
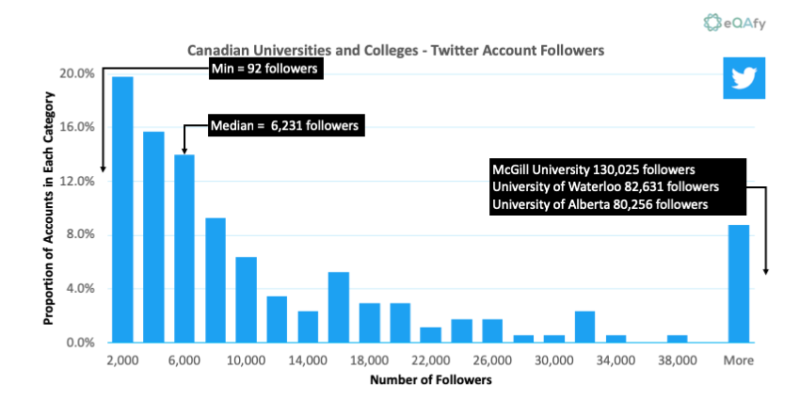
In common with the Facebook and Instagram data distributions, a group of outliers, McGill, Waterloo and the University of Alberta have amassed 13% of all Canadian higher education Twitter followers.
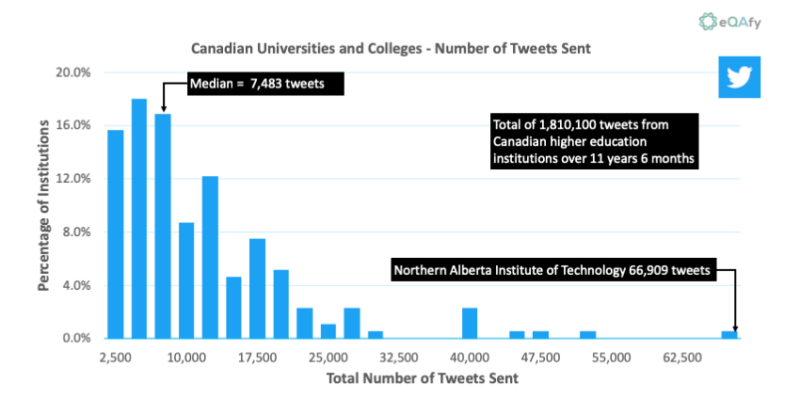
Canada’s higher education sector has tweeted 1.8 million times over the past 12. But, as Chart 6 shows, a small number of universities dominate Twitter output. Eighty per cent of accounts have tweeted fewer than 16,500 times.
While Twitter has existed since 2006, we are not convinced that it has found a broad audience within higher education’s digital ecosystem. Anecdotally, current students and alumni are not big Twitter users, however, institutional Twitter accounts are important for breaking news, reports and official releases – more of a PR audience?
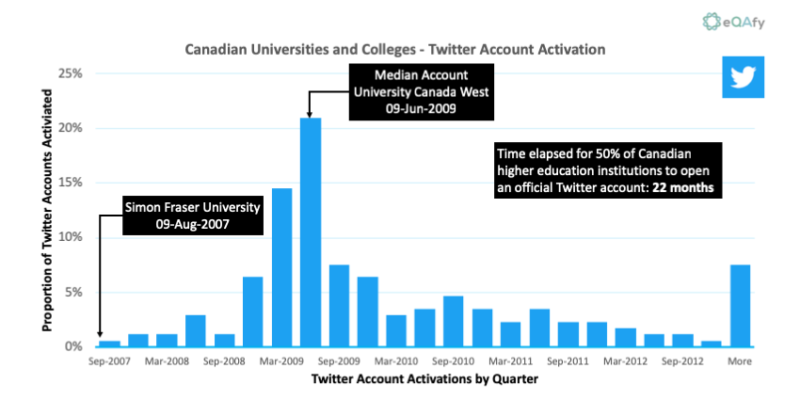
Whatever our current concerns might be about Twitter’s role, the network was highly effective in building its network. Fifty per cent of Canadian post-secondary institutions activated official accounts within two years of Canada’s first university going live on Twitter.
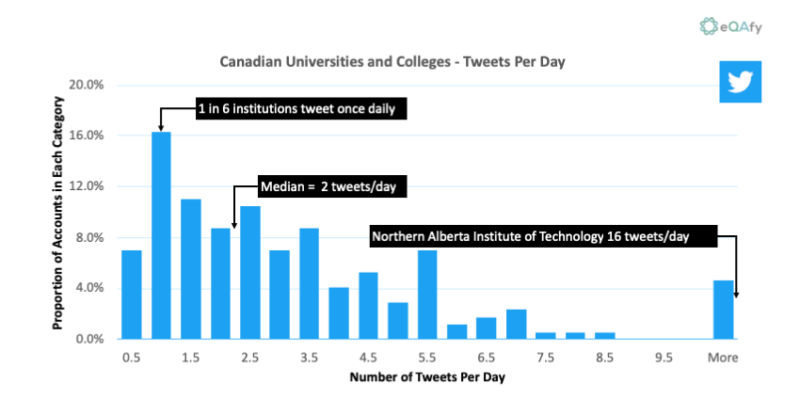
Since activation their accounts, the typical higher education Twitter account tweets twice daily. One in six accounts tweets only daily. Is the observed output level a clear strategy with a measurable impact or a default position reflecting available content, resources and social network competition?
As our earlier post revealed, Canadian higher education institutional LinkedIn accounts have attracted an audience 46% larger than Facebook. At a guess, we doubt that LinkedIn reaches many undergraduates, but graduate students, alumni and external university and college partners are likely to form the majority of network connections.
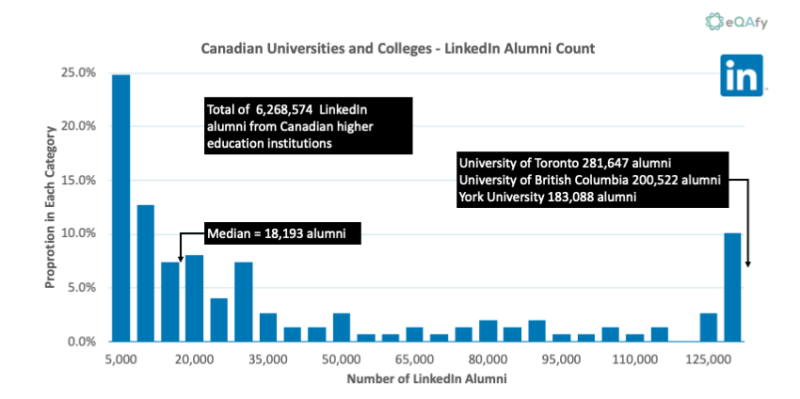
Chart 9 reflects the data distribution from Facebook, Instagram and Twitter – a group of institutions with relatively low follower counts (or alumni, in this case) in contrast to a cluster of universities with disproportionately large follower numbers. In LinkedIn’s case the leaders comprise the University of Toronto, UBC and York University.
The median college or university has 18,190 alumni on LinkedIn. We’ve treated LinkedIn’s alumni member count as a proxy for an institution’s addressable market. We can thus normalize follower counts to estimate how effectively an institution reaches its audience.
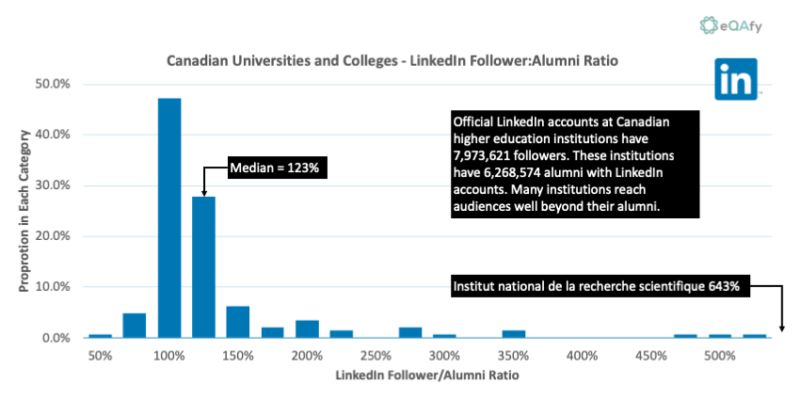
In chart 10 we can see that typical institutions have 20% more followers than alumni and are reaching a wider audience than just their graduates. In one case, the Institut national de la recherche scientifique (INRS) has over six times more followers than alumni on LinkedIn: an indication that INRS is reaching a significantly wider audience.
YouTube
Higher education’s nearly universal YouTube uptake is solid evidence of institutional adoption and investment in video content strategies. But, as YouTube channel and page visitors don’t need to subscribe to view content, we haven’t analysed subscriber numbers (although these are generally modest).
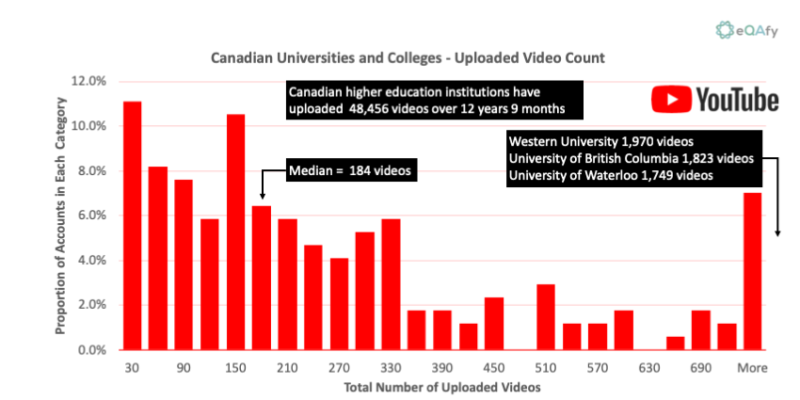
Instead, we’ve examined the number of views of uploaded video content as a more informative engagement measure. Chart 11 plots the proportion of institutions (vertical axis) against numbers of video uploads on the horizontal axis.
Overall, Canada’s universities and colleges have uploaded close to 50,000 videos over the past 13 years. The median post-secondary institution has uploaded 184 videos. And, 80% of institutions have fewer than 410 videos in their official channel.
Once again, a collection of larger institutions have uploaded multiples of the median upload numbers: for YouTube, these are Western University, UBC and Waterloo.
As with Facebook Likes, YouTube views data spans a significant range, so we divided Canada’s higher education institutions into two groups for analysis. Group I comprising YouTube accounts with fewer than 350,000 video views and Group II with more than 350,000 views.
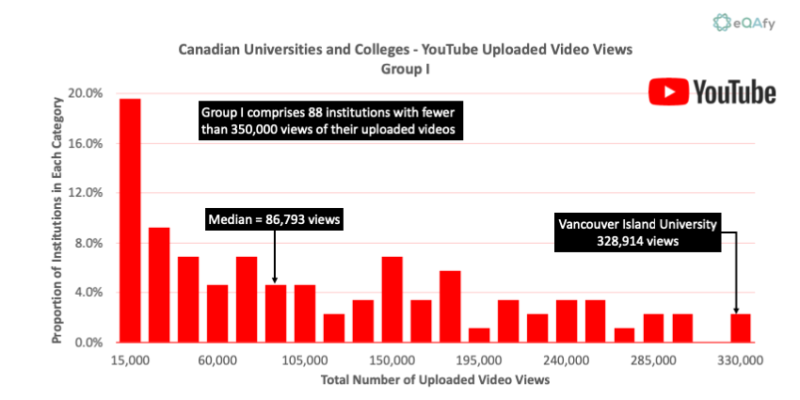
Chart 12 is a histogram of the uploaded video view data for Group I. The y-axis records the proportion of the 88 institutions in each of the viewing number category buckets on the x-axis: for example, 20% of institutions in Group I have 15,000 views or less.
For benchmarking purposes we’ve calculated the median value of Group I’s views: 86,793 views. In other words, 50% of Group I institutions have fewer than 86,793 views and 50% have more. Group I’s most successful institution is Vancouver Island University who’s YouTube account has had close to 330,000 views, as of mid-February 2019.
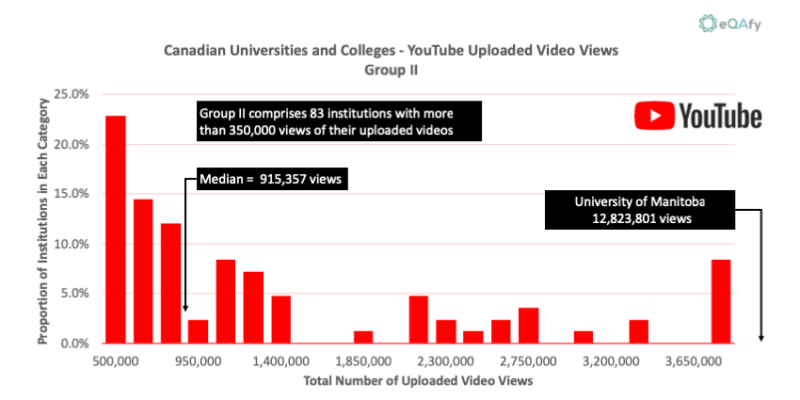
Group II’s data, shown in Chart 13, comprises the remaining 83 institutions, those with accounts that have had more than 350,000 views. Group II’s median value is 915,360 views – more than 10 times Group I’s median value. However, overall, 80% of all institutions have fewer than 1 million YouTube video views.
The outlier is the University of Manitoba with almost 13 million views of its uploaded videos and one video that accounts for over half that total.
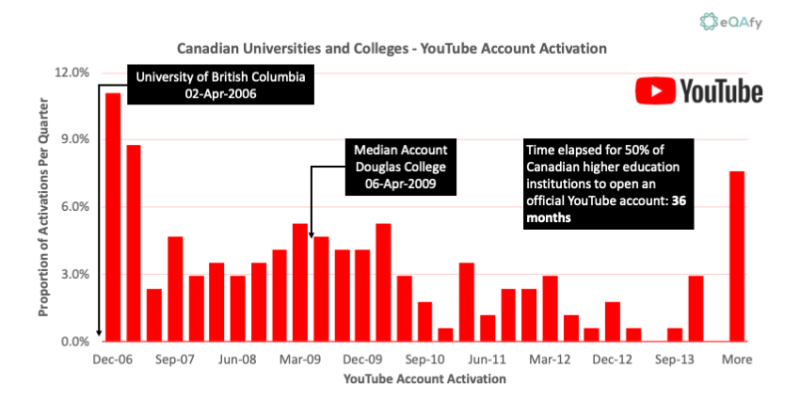
UBC activated the first Canadian higher education YouTube account in April 2006 and 50% market penetration was reached 36 months later when Douglas College activated its account in April 2009. By contrast Twitter reached the same 50% threshold in 22 months.
Conclusions
Social media is now a basic element of university and college digital communications and marketing. While networks offer detailed analytics, it can be harder to see the broader context and set appropriate targets, based on realistic benchmarks.
In this post we’ve extracted some of the key engagement and content creation metrics for the principal social networks that Canada’s higher education institutions use. Those metrics can inform the inevitable content creation and content type trade-offs that have to be made when time and financial and human resources are constrained.
We omitted some further YouTube content analysis from this post, but if you’re addicted to video you can find what we picked up from the cutting room floor here: All Aboard the YouTube Train.